Virtually every trader has dabbled with or experimented with some sort of moving average. What I want to introduce you to in this lesson is a different sort of moving average cross method, which I have found to be very good at identifying short term trend changes.
As we know a moving average is normally plotted using the close of a bar e.g. if you were plotting a 3 period moving average, then you would add the last three closes and divide the total by three to get a simple moving average.
This is where I want you to think a little differently. I have always been an advocate of taking traditional thinking and changing it around. What if you used the open instead of the close? What if you used the close of one period of a moving average and the open of another?
First, most charting packages will allow you to use the open, high, low or close to plot a moving average.

In the example below of the daily Dow Jones, I have used a 5 period exponential moving average of the close and a 6 period exponential moving average of the open. As you can see it catches the short term trend changes really nicely.

In the next example of the 1 hour EUR/USD, you can see that the close/open combination worked really well. Of course you will go through periods of consolidation with any market and any moving average method you use will be whipsawed. To get around this you need some sort of filter or approach that helps you keep out of the low probability trades.
You could use ADX, Stochastic or MACD to help filter the noise but I also like to add a time frame.

In the next example of the 4 hour GBP/USD you can see that on the 24th September 04 at 4:00 there was a cross of the 5 period exponential moving average of the close above the 6 period exponential moving average of the open. This signal has remained in place until today as I write on the 27th September.

Although there was a signal on the 4 hour, to help identify even better entry points you can drop down a few time frames to the 30 minute chart. As you can see from the 30 minute chart there have been quite a few crosses of the 5 period exponential moving of the close above or below the 6 period exponential moving average of the open.

There are lots of ways to trade this but a neat little trick is to wait for the signal on a higher time frame and then drop down a few time frames and wait for a pullback. The first signal after the pullback on the lower time frame is normally a pretty good entry point e.g. If there were a cross up on the large time frame then drop down to a lower time frame and wait for the market to retrace and then give another buy signal (cross up). The opposite is true for short signals.
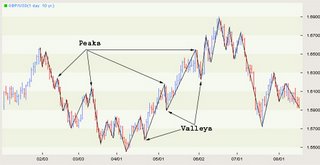
Once you get the signal on the shorter time frame depending on where support is you can usually place your first stop loss under the nearest support area (valley). If the market begins to make progress you can move your stop so that it trails the market by moving your stop to just under the most recent support area.
In this lesson I have use an exponential moving average but experiment with different types of average such as weighted, smoothed or simple. You can also experiment with different lengths of moving average.
surefire-trading.com
