Monday, December 25, 2006

Forex 1-2-3 Method

This particular technique has been around for a long time and I first saw it used in the futures market. Since then I have seen traders using it on just about every market and when applied well, can give amazingly accurate entry levels.


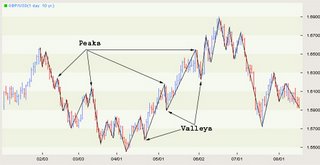
Lets first start with the basic concept. During the course of any trend, either up or down, the market will form little peaks and valleys. see the chart below:


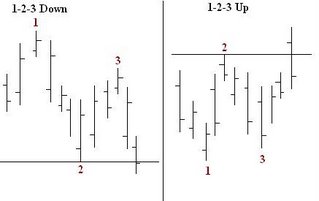
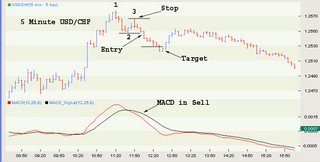
The problem is, how do you know when to enter the market and where do you get out. This is where the 1-2-3 method comes in. First let's look at a typical 1-2-3 set up:


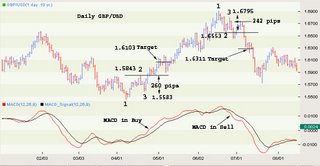
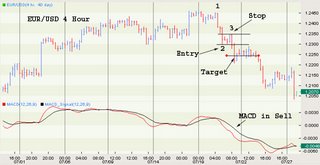
Nice and simple, but it still doesn't tell us if we should take the trade. For this we add an indictor. You could use just about any indictor with this method but my preferred indictor is MACD with the standard settings of 12,26,9. With the indictor added, it now looks like this:


Now here is where it gets interesting. The rules for the trade are as follows:

Uptrend

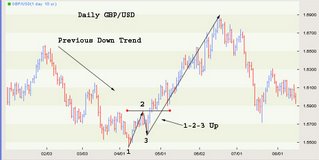
1. This works best as a reversal pattern so identify a previous downtrend
2. Wait for the MACD to signal a buy and for the 1-2-3 set up to be in place.
3. As the market pulls back to point 3, the MACD should remain in buy mode or just slightly dip into sell.
4. Place a buy entry order 1 pip above point 2
5. Place a stop loss order 1 pip below point 3
6. Measure the distance between point 2 and 3 and project that forward for your exit.
7. Point 2, should not be lower than point 1

The reverse is true for short trades. As the market progresses you can trail your stop to 1 pip below the most recent low (Valley in an uptrend). You can also use a break in a trend line as an exit.

Some examples:


There are a lot of variations on the 1-2-3 setup but the basic concept is always the same. Try experimenting with it on your favorite time frame.

Written by Surefire Forex Trading

Friday, December 15, 2006

A Different Type of Moving Average Cross

Virtually every trader has dabbled with or experimented with some sort of moving average. What I want to introduce you to in this lesson is a different sort of moving average cross method, which I have found to be very good at identifying short term trend changes.

As we know a moving average is normally plotted using the close of a bar e.g. if you were plotting a 3 period moving average, then you would add the last three closes and divide the total by three to get a simple moving average.

This is where I want you to think a little differently. I have always been an advocate of taking traditional thinking and changing it around. What if you used the open instead of the close? What if you used the close of one period of a moving average and the open of another?

First, most charting packages will allow you to use the open, high, low or close to plot a moving average.


In the example below of the daily Dow Jones, I have used a 5 period exponential moving average of the close and a 6 period exponential moving average of the open. As you can see it catches the short term trend changes really nicely.


In the next example of the 1 hour EUR/USD, you can see that the close/open combination worked really well. Of course you will go through periods of consolidation with any market and any moving average method you use will be whipsawed. To get around this you need some sort of filter or approach that helps you keep out of the low probability trades.

You could use ADX, Stochastic or MACD to help filter the noise but I also like to add a time frame.


In the next example of the 4 hour GBP/USD you can see that on the 24th September 04 at 4:00 there was a cross of the 5 period exponential moving average of the close above the 6 period exponential moving average of the open. This signal has remained in place until today as I write on the 27th September.


Although there was a signal on the 4 hour, to help identify even better entry points you can drop down a few time frames to the 30 minute chart. As you can see from the 30 minute chart there have been quite a few crosses of the 5 period exponential moving of the close above or below the 6 period exponential moving average of the open.


There are lots of ways to trade this but a neat little trick is to wait for the signal on a higher time frame and then drop down a few time frames and wait for a pullback. The first signal after the pullback on the lower time frame is normally a pretty good entry point e.g. If there were a cross up on the large time frame then drop down to a lower time frame and wait for the market to retrace and then give another buy signal (cross up). The opposite is true for short signals.

Once you get the signal on the shorter time frame depending on where support is you can usually place your first stop loss under the nearest support area (valley). If the market begins to make progress you can move your stop so that it trails the market by moving your stop to just under the most recent support area.

In this lesson I have use an exponential moving average but experiment with different types of average such as weighted, smoothed or simple. You can also experiment with different lengths of moving average.


surefire-trading.com

Saturday, November 25, 2006

How To Handle A String Of Investment Losses

Everybody hates to lose and unfortunately no one is blessed with the ability of foresight, therefore losses are an unavoidable part of trading. When we enter a trade we will either be right, or wrong, and even if we broke-even we'd still be classed as being wrong - as nobody enters into a trade just to break-even! When unsuccessful traders encounter a string of losses they begin to engage in self-destructive patterns that help them escape the pain they are experiencing.

Bring to light these self-destructive actions that can help you realize what you are doing before it takes hold of your physical health. If you find yourself already engaged in these patterns hopefully this article can help you to get you back on track as quickly as possible.

What are the destructive patterns?

If you find yourself caught in a string of losses or a bad performing week/month be sure to monitor your behavior. It is during this time that you will be at your most vulnerable. You will begin to indulge in activities that at first seem harmless, but upon excessive use (or in time), begin to cause physical damage to your health.

Ask yourself the following question: during drawdown periods do I find myself over-indulging in these activities:

Food (especially junk food - e.g. chocolate, ice-cream, chips)?

Sex (includes viewing pornography)?

Alcohol?

Drugs (includes excessive smoking)?

Laziness (find it difficult to wake up in the morning)?

Entertainment?

All of the above taken in excessive doses can be detrimental to your own physical health (some even in small doses!).

These activities above during your losing period are only covering up the pain of confronting the true issue, and your body tries to rid the emotional pain by trying to "fix" it with physical pleasures. Unfortunately it is going about it in the wrong way, so what should you do?

Firstly... REALIZE WHAT YOU ARE DOING AND STOP IT!

You need to realize what you're doing and you need to STOP doing it immediately! You can either decide to stop, or you'll be forced to stop when your body eventually breaks down and prevents you from any form of movement. It will be much more beneficial to you in the long-term if you can decide to stop *NOW*.

Once you have stopped you now need to figure out a way to solve the pain - not by cutting out or neglecting it, but by staring it in the face. Bring your problems out into the light, be honest with yourself. There can be no growth without pain; you are experiencing the emotional pain, now it is time to find the error and therefore your growth.

Begin Your Review

The review process begins in two separate areas: You & Your System. Here are some checklists for you to go through to find out where the problem could lie:

"YOUR SYSTEM" CHECKLIST

Was your system thoroughly tested prior to trading it (or paper traded if you do not have the capacity to program your system into back testing software)?

Did you test with out-of-sample data?

Do you even have a system???? If you do not, how do you even know if the method that you are trading is even profitable??

Is your system's code correct?

Did you over-optimize your system? (What have we discussed about over-indulging?)

Did you paper trade your system prior to placing capital on it?

Did you trade with a small amount of capital prior to placing the rest of your funds on it?

Do you know the system's limitations?

Did you properly drill your system? (See our blog article on why I am the system designer from hell)

"YOU" CHECKLIST

Is the current drawdown you are exhibiting with your system normal?

Are you comfortable with your system's historical drawdown performance?

Are you fully aware of the risks involved with your system and the instrument(s) you are trading?

Are you trading with funds that you are comfortable risking?

Are you relying too heavily on your performance?

Have you set realistic goals?

As you can see there are generally two areas that you need to explore: the mechanical aspect - your system - and the emotional aspect - you. Both can be responsible for making the way you feel the way you do. It will either be an error on the system's side with how the system was tested and/or programmed, or it can be your own psychological profile not being comfortable with the system's performance.

Your Answers = Change = Your Growth

What steps should we now take? Now that we have begun a corrective process where we have stopped the evil nature of our over-indulging ways to take control we should continue our "corrective nature" by invoking our findings and taking ACTION in correcting our errors.

If the problem was mechanical - fix it, if the problem was emotional either go about setting up new thought patterns, or change your current system. The answers lie in whether you need to expand your knowledge in system development, or whether you need to grow emotionally as a person.

Unfortunately there is no easy road, and even if there was everybody would be doing it. Hopefully this article has made you ponder over some of your behaviors during drawdown periods, be sure to keep an eye on yourself and as always take care of your body, because there's no use in making all the money in the world when you don't have the physical capacity to enjoy it

Article Source: kokkada.com

See also:
How To Use MACD
Easy-Forex? The best trading platform available today.
Forex Trading Explained
Institutional Forex System
The MasterTrader eBook
Forex Profits

Tuesday, October 31, 2006

Combining RSI and ADX

Now that I am spending seven hours a day doing trading for the new hedge fund I haven't had much time for research or writing new Bulletins. However a comment in one of the trading newsgroups that I monitor got me thinking about the potential benefits of combining our knowledge of RSI and ADX into a simple system. Both the ADX and RSI are valuable trading tools and a combination of the two would seem to offer some interesting possibilities. I like to use the RSI primarily as an indicator for buying on dips in an uptrend. The ADX is my primary indicator of trend strength.

Here are a few ideas on how the two indicators might compliment each other in a system that "knows" when to enter on strength and when to buys on dips. (I'm only going to use the long side for examples but the logic should apply to short trades as well.)

When the ADX is rising it usually indicates that a strong trend is underway. In many cases waiting for any sizeable dip would be costly because the market could run away and the dip entry would be too late to maximize our profits. In this case we must enter on strength. To make this idea into a simple trading rule we might state that if the ADX is rising (and we have some indication it is rising because an uptrend is underway) we will buy whenever the RSI is below some very high threshold like 85. This rule would give us a very prompt entry in most cases and the result would be almost identical to simply trading whenever the ADX is rising which seems to be a good idea. The RSI has little, if any, benefit in this situation except it might occasionally keep us from buying into an extremely overbought market where the RSI was above 85. In this case a slight delay on the entry might be prudent.

The RSI, however, can play a much more important role when the ADX is flat or declining. In this case the rule would be that when the ADX is not rising we should postpone our entry until the RSI is below some more typical threshold like 45 or 50. Since the ADX is not giving us a signal that the trend is unusually strong we would need some additional indicator to show that the market has some minimal amount of upward direction. Otherwise we would not be buying a dip within the framework of an uptrend. Something simple like an upward sloping 20-bar moving average might work in this application.

Now that we have combined the ADX and RSI for our entries we might also want to combine them for our exits. When a market is rising but the trend is not particularly strong any spike in the RSI represents a good opportunity to take a profit. For example when trading in stocks the 9-bar RSI rising above 75 or 80 often signals that a correction is imminent. If the market trend is not unusually strong we would probably be happy with taking our profit on strength rather than waiting to get stopped out on weakness. However if the ADX is rising we might want to risk a correction in hopes of riding the trend even further. In this case when the ADX was rising we would ignore the RSI signal to take our profit. However, once our patience has allowed us to accumulate a very substantial open profit we might be best served by acting on the next RSI signal and nailing down the big winner. Also, when the ADX is rising it would not make much sense to be buying at a high RSI level and also selling at a high RSI level. We would be in and out of our trades almost immediately. Therefore we need to ignore the RSI extremes until our profit has had a chance to accumulate.

In summary, the important concept to remember is that our knowledge of the ADX can make the RSI a much more useful trading tool. When the ADX is rising the RSI tends to get overbought and it can often remain overbought for a surprising length of time. On the other hand when the ADX is flat or declining any spike to the upside in the RSI is an opportunity to nail down a profit. Conversely, any spike to the downside can be a potentially profitable entry point.

Here is the logic of a simple little system based on this discussion. (Just the rules in text form, you will have to do your own coding.) The parameters selected have not been tested or optimized. For example the 20-day moving average is just a number I picked out of the air. This is enough information to get you started and you can vary the rules to make the system trade over whatever time frame you prefer.

Long Entries:
1. The 20-bar moving average must be rising.
2. If the ADX is rising (ADX today is 0.20 or more higher than yesterday) then buy if the 14 bar RSI is less than 85.
3. If the ADX is not rising (ADX today is not 0.20 higher than yesterday) then buy if the 14 bar RSI is less than 50. Here is where you can influence the frequency of trading. For more trades use a higher threshold like 60. For fewer trades use a lower threshold like 40.

Long Exits
1. If the ADX is not rising (ADX today is not 0.20 higher than yesterday) then sell (long exit) if the 9-bar RSI is greater than 75.
2. If the ADX is rising (ADX today is 0.20 or more higher than yesterday) and the open profit is greater than (pick some amount - maybe 4 ATRs or some unit of price) then sell if the 9-bar RSI is greater than 75.
3. You need some additional exit rule for the losing trades. Use your favorite loss-limiting exit or you might want to exit when the price goes below the 20-dat moving average or when the 20-day moving average turns down. (See entry rule 1.)

Good luck and good trading.

by Chuck LeBeau

Wednesday, September 20, 2006

What is Technical Analysis

When trading in the foreign exchange market, part of the process involves forecasting future price movements in order to determine the best time to buy and sell. One method, called technical analysis, takes a look at the market’s past price movements to determine where the numbers will go in the future. Most investors who employ this type of analysis look mostly at price data, but sometimes information such as volume and open interest in futures contracts are also taken into consideration. If you’re just starting out in forex, the rule of thumb is to keep your methods simple - follow the basics, which have been proven over time, and only when you have gained some experience introduce more difficult techniques into your plans.

Technical analysis is almost always used on some level because price charts provide a good visual representation of the price history of a particular currency. At the very least, they can help you determine ideal entry and exit points for a trade based on the historical data. You can decide whether or not you’re buying at a fair price, selling at the top of a cycle, or entering into a shaky market.

It may seem as if adherents of technical analysis disregard market fundamentals in favor of mounds of charts and data, but they argue that these fundamentals are ingrained in the actual numbers. Something unpredictable may cause the numbers to unexpectedly spike, but you can still analyze the data, and identify patterns that will aid you in forecasting future prices.

Essentially, technical analysis can be summed up in three points. First of all, as mentioned above, technical traders assume that market fundamentals are tied to the price data. This is why factors such as the fear, hope, and mood of market participants are not contemplated directly.

Secondly, the idea that history repeats itself is core to this system of analysis. It is possible to look for patterns in price movement (called signals) because the market is predictable. When you look at past market signals you should be able to predict future signals.

Lastly, technicians rely on trends. From this analytical perspective, the market is not irregular or unpredictable. Rather, you can determine, to a high degree of accuracy, what direction a price will take: up, down, or sideways. In addition, trends are expected to continue for a period of time, making it possible to formulate predictions.

But it’s important to understand that technical analysts use more than price charts to determine good entry and exit points. Price charts are used in conjunction with volume charts, and other mathematical representations of market signals. Called studies, these additional pieces of information add another layer of data to the analysis. They let the trader look at the strength and sustainability of trends, in addition to the bare statistics.

Technical analysis is, of course, quite complicated - but for the new trader just starting out in forex, following the basics is a good place to begin. After you gain some experience and learn more about the foreign exchange market, you can delve into more complex research strategies.

Article Source: kokkada.com

See also:
How To Use MACD
Easy-Forex? The best trading platform available today.
Forex Trading Explained
Institutional Forex System
The MasterTrader eBook
Forex Profits

Friday, September 08, 2006

Short Term Analysis - September 8, 2006

AUDUSD

Key support at 0.7626 is broken below, AUDUSD will fall towards 0.7550 to reach the next cycle bottom. If 0.7550 support gives way, further fall towards 0.7400 area is possible in the next one or two weeks.


EURUSD

EURUSD fell below the support at 0.2725, further fall towards 1.2650 area to reach the next cycle bottom is possible in the next several days. Key resistance is now at 1.2830, break above this level may signal the cycle bottom.


USDCAD

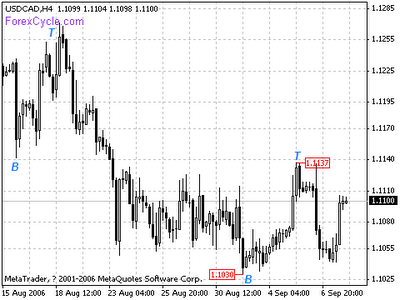
USDCAD rebound from the support at 1.1030. It is forming a sideways consolidation on 4 hours chart. Key resistance is at 1.1137, a break above this level may signal the cycle bottom at 1.1030. On the other side, if near term support at 1.1030 gives way, the pair would fall towards 1.0950.


GBPUSD

GBPUSD fall below the key support at 1.8793, further fall towards 1.8600 area to reach the next cycle bottom is still possible in the next several days. Key resistance is at 1.8955, only break above this level may signal the reversal to the down trend.


USDJPY

USDJPY stay in the rising price channel. Further rise above 117.49 is possible in the next several days. Key support is at 115.57, as long as this support holds, up trend will continue.


USDCHF

USDCHF rose above 1.2444. Further rise towards 1.2500 area is still possible later today. Key support is at 1.2326, only break below this level may signal the reversal to the up trend.


-------
Our server downed. We post the Short Term Analysis here temporary.

Franco
ForexCycle.com

Monday, September 04, 2006

How to stop loss

Using Stop Loss in anytime we enter the market is one way to manage our risk in trading. While some other traders might consider it as the sissy way, I don't….. I like to trade using Stop Loss. And it brings me to good results in the end of the day. Keeps me stick with well-controlled trading system.

When we decide to use stop loss, then we must be discipline in implementing it. If market price is heading so close to our stop loss, then we must not do anything. Do not ever try to replace your stop loss at further level from your open position level.

Replace your stop loss only for one reason:
For Trailing Stop Strategy (although I hardly ever use trailing stop strategy).

Now the problem is… where should we put our stop loss in each trading? Here are some tips I could give you:

1. Measure the gap between your stop loss and your open position level.
Usually I use these rules:

Eur/Usd: gap between stop loss and open position = 35 pips

Gbp/Usd: gap between stop loss and open position = 50 pips

These are representing maximum losses that you could handle in each trade. Keep that always in mind. We're not going to enter the market without this gap rule.

2. Entry strategy
Then you could predict your best entry level using your trading system. And when you decide to enter the market at certain level (using your trading strategy), do not forget to pay attention to your stop loss. Where will your stop loss be placed using the gap rule on tips #1.

Try to put your stop loss below Support Level (for Long position) or above Resistance Level (for short position).

For example:

We had Eur/Usd support and resistance levels are at:

R3 1.3052

R2 1.2962

R1 1.2906

Pivot 1.2816

S1 1.2760

S2 1.2670

S3 1.2614

Then after measuring the trend, you noticed that 1.2870 is the best place to short on eur/usd. That means, by using 35 gaps rule (see point#1), your Stop Loss would be at 1.2905.

Unfortunately, 1.2905 is not a good level to place your Stop Loss. Why? It is not protected by resistance level. When market moves upward, your Stop Loss is not well protected by its technical factor. So it would be quite easy for the market to hit your Stop Loss. Nearest resistance is 1.2906, above 1.2905. So what do we do here is to move our Stop Loss a little above 1.2905. Let's say we move it to 1.2910. Now technically, you have a well protected stop loss.

When you move Stop Loss, do not forget about the gap rule (as said in point#1). So we have to move also our open position plan.

And now, your plan becomes Short at 1.2875 (5 pips above 1.2870) and Stop Loss at 1.2910 (5 pips above 1.2905).

3. Keep calm when market heading so close to your stop loss.
Anything could happen in Forex in very short time. No one can control people madness when they enter the market. But the most important thing in dealing with this mad world is 'risk management'. Successful traders realize that sometimes they had to deal with fail trades.

So if your stop loss is hit, let it go. That's just the way it is.

Article Source: kokkada.com

See also:
How To Use MACD
Easy-Forex? The best trading platform available today.
Forex Trading Explained
Institutional Forex System
The MasterTrader eBook
Forex Profits

Tuesday, August 29, 2006

Head and shoulders appears in the GBPUSD chart

GBPUSD has formed a Head and Shoulder pattern, neck line has been broken above, and up trend has been confirmed. Target is expected at 1.9250 level.

Thursday, August 24, 2006

How To Use MACD

I love a good love-hate relationship, and that's what I've got with technical indicators Technical indicators are those fancy computerized studies that you frequently see at the bottom of price charts that are supposed to tell you what the market is going to do next (as if they really could). The most common studies include MACD, Stochastics, RSI and ADX, just to name a few.

The No.1 (and Only) Reason To Hate Technical Indicators
I often hate technical studies because they divert my attention from what's most important – PRICE.

Have you ever been to a magic show? Isn't it amazing how magicians pull rabbits out of hats and make all those things disappear? Of course, the "amazing" is only possible because you're looking at one hand when you should be watching the other. Magicians succeed at performing their tricks to the extent that they succeed at diverting your attention.

That's why I hate technical indicators; they dived my attention the same way magicians do Nevertheless, I have found a way to live with them, and I do use them Here's how: Rather than using technical indicators as a means to gauge momentum or pick tops and bottoms, I use them to identify potential trade setups.

Three Reasons To Learn To Love Technical Indicators
Out of the hundreds of technical indicators I have worked with over the years, my favorite study is MACD (an acronym for Moving Average Convergence-Divergence) MACD, which was developed by Gerald Appel, uses two exponential moving averages (12-period and 26-period). The difference between these two moving averages is the MACD line. The trigger or Signal line is a 9-period exponential moving average of the MACD line (usually seen as 12/26/9…so don't misinterpret it as a date) Even though the standard settings for MACD are 12/26/9, I like to use 12/25/9 (it's just me being different). An example of MACD is shown in Figure 10-1 (Coffee).


The simplest trading rule for MACD is to buy when the Signal line (the thin line) crosses above the MACD line (the thick line), and sell when the Signal line crosses below the MACD line Some charting systems (like Genesis or CQG) may refer to the Signal line as MACD and the MACD line as MACDA Figure 10-2 (Coffee) highlights the buy-and-sell signals generated Item this very basic interpretation.


Although many people use MACD this way, I choose not to, primarily because MACD is a t rend-following or momentum indicator. An indicator that follows trends in a sideways market (which some say is the state of markets 80% of time) will get you killed For that reason, I like to locus on different information that I've observed and named: Hooks, Slingshots and Zero-Line Reversals Once I explain these, you'll understand why I've learned to love technical indicators.

Hooks
A Hook occurs when the Signal line penetrates, or attempts to penetrate, the MACD line and then reverses at the last moment. An example era Hook is illustrated in Figure 10-3 (Coffee).


I like Hooks because they fit my personality as a trader. As I have mentioned before. I like to buy pullbacks in uptrends and sell bounces in downtrends. And Hooks do just that - they identify countertrend moves within trending markets.

In addition to identifying potential trade setups, you can also use Hooks as confirmation. Rather than entering a position on a cross-over between the Signal line and MACD line, wait for a Hook to occur to provide confirmation that a trend change has indeed occurred Doing so increases your confidence in the signal, because now you have two pieces of information in agreement.

Figure 10-4 (Live Cattle) illustrates exactly what I want this indicator to do: alert me to the possibility of rejoining the trend In Figure 10-5 (Soybeans), I highlight two instances where the Hook technique worked and two where it didn't.


But is it really fair to say that the signal didn't work? Probably not, because a Hook should really just be a big red flag, saying that the larger trend may be ready to resume. It's not a trading system that I blindly follow All I'm looking for is a heads-up that the larger trend is possibly resuming. From that point on, I am comfortable making my own trading decisions. If you use it simply as an alert mechanism, it does work 100% of the time.

Slingshots
Another pattern I look for when using MACD is called a Slingshot. To get a mental picture of this indicator pattern, think the opposite of divergence. Divergence occurs when prices move in one direction (up or down) and an indicator based on those prices moves in the opposite direction.

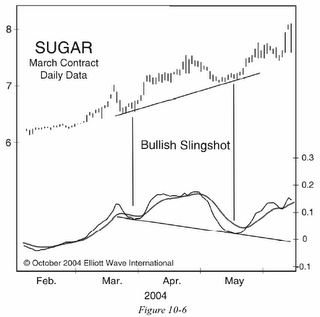
A bullish Slingshot occurs when the current swing low is above a previous swing low (swing lows or highs are simply previous extremes in price), while the corresponding readings in MACD are just the opposite Notice in Figure 10-6 (Sugar) how the May low was above the late March swing low However, in May, the MACD reading tell below the level that occurred in March. This is a bullish Slingshot, which usually identifies a market that is about to make a sizable move to the upside (which Sugar did).


A bearish Slingshot is just the opposite: Prices make a lower swing high than the previous swing high, but the corresponding extreme in MACD is above the previous extreme Figure 10-7 (Soybeans) shows an example era bearish Slingshot.


Zero-Line Reversals
The final trade setup that MACD provides me with is something I call a Zero-Line Reversal (ZLR). A Zero-Line Reversal occurs when either the Signal line or the MACD line Falls (or rallies) to near zero, and then reverses It's similar in concept to the hook technique described above The difference is that instead of looking for the Signal line to reverse near the MACD line, you're looking for reversals in either the Signal line or the MACD line near zero. Let's look at some examples of Zero-Line Reversals and I'm sure you'll see what I mean.

In Figure 10-8 (Sugar), you can see two Zero-Line Reversals Each time, MACD reversed above the zero-line, which means they were both bullish signals When a Zero-Line Reversal occurs from below, it's bearish. Figure 10-9 (Soybeans) shows an example of one bullish ZLR from above, and three bearish reversals from below. If you recall what happened with Soybeans in September 2005, the bearish ZLR that occurred early that month was part of our bearish Slingshot from Figure 10-7 These combined signals were a great indication that the August advance was merely a correction within the larger sell-off that began in April That meant that lower prices were forthcoming, as forecast in tile August and September issues of Monthly Futures Junctures.


So there you have it, a quick rundown on how I use MACD to alert me to potential trading opportunities (which I love) Rather than using MACD as a mechanical buy-sell system or using it to identify strength or weakness in a market, I use MACD to help me spot trades And the Hook, Sling-shot and Zero-Line Reversal are just a few trade setups that MACD of offers.

Article Source: elliottwave.com

Tuesday, August 22, 2006

Why trading diary is important to improve your forex trading

Do you have a habit to write trading diaries? I think it's important for a trader to write down their trading records. Most traders spend all their time for searching news of the market, looking at the charts they planning to trade. Of course, all of these are important for your trading. Recording your trading transactions is just as important.

Traders always lost himself in mass of trading records. What currency pair did you trade? Why did you place these orders? Are all of these trading decisions according to your strategies, if you really have some? In order to answer all of these questions, mark up all your trading records in a diary.

What should it contain?

  • Currency pairs
  • Buy/sell date and price
  • profit/loss
  • Entry strategy
  • Exit Strategy
  • Comments
You can review the results of your trading by the end of every week or month and benefit from this good habit. This method is key to improving your trading skills.

Tuesday, August 15, 2006

Timing Is Everything

They say that 'timing is everything' and it's never more than true when looking to commit to an online investment. For the comedian, actor, athlete and politician timing is a key skill in success. Being in the right place at the right time is part of the skill (or luck) of any kind of success. The basketball or football player needs to be doing the right thing when the scout is about. The busker singing on the street can have their lives changed if a record producer happens to be walking past.

So is success down to luck - well yes and no. I'm a big believer in creating your own luck. If you put yourself about, take risks (albeit calculated ones) and put yourself in situations where opportunity can be seized.

The most common piece of investment advice given is 'get into property' and as a general rule it's sound advice. Property in general appreciates in value over time and delivers a return on investment significantly better than any bank or savings scheme can offer. However - timing can make or break the investment opportunity. Many have been caught short by entering the property market at the wrong time and making very little - and in some sad cases ending up in negative equity. If you buy in a town that is on the rise - then you'll make money from your investment. If you buy in town and a factory then lays of 1,000 employees causing widespread unemployment - there's a good chance that you could lose money, see very little growth or have to wait a long time to see a return on your investment.

If I could give only one piece of investment advice it would be to develop the skill of being able to spot opportunities. Broaden your perspective – think laterally and learn how to read how events will shape things financially and then make calculated decisions based on those factors. If you can learn this new kind of thinking – then you will see investment opportunities others miss – and most importantly you will see them in time to get in early.

For a prime example of a time sensitive online investment opportunity that will give you a fantastic return on investment go to http://online-investment-secrets.com.

Article Source: kokkada.com

Monday, August 14, 2006

How To Handle A String Of Investment Losses

Everybody hates to lose and unfortunately no one is blessed with the ability of foresight, therefore losses are an unavoidable part of trading. When we enter a trade we will either be right, or wrong, and even if we broke-even we'd still be classed as being wrong - as nobody enters into a trade just to break-even! When unsuccessful traders encounter a string of losses they begin to engage in self-destructive patterns that help them escape the pain they are experiencing.

Bring to light these self-destructive actions that can help you realize what you are doing before it takes hold of your physical health. If you find yourself already engaged in these patterns hopefully this article can help you to get you back on track as quickly as possible.

What are the destructive patterns?

If you find yourself caught in a string of losses or a bad performing week/month be sure to monitor your behavior. It is during this time that you will be at your most vulnerable. You will begin to indulge in activities that at first seem harmless, but upon excessive use (or in time), begin to cause physical damage to your health.

Ask yourself the following question: during drawdown periods do I find myself over-indulging in these activities:

Food (especially junk food - e.g. chocolate, ice-cream, chips)?

Sex (includes viewing pornography)?

Alcohol?

Drugs (includes excessive smoking)?

Laziness (find it difficult to wake up in the morning)?

Entertainment?

All of the above taken in excessive doses can be detrimental to your own physical health (some even in small doses!).

These activities above during your losing period are only covering up the pain of confronting the true issue, and your body tries to rid the emotional pain by trying to "fix" it with physical pleasures. Unfortunately it is going about it in the wrong way, so what should you do?

Firstly... REALIZE WHAT YOU ARE DOING AND STOP IT!

You need to realize what you're doing and you need to STOP doing it immediately! You can either decide to stop, or you'll be forced to stop when your body eventually breaks down and prevents you from any form of movement. It will be much more beneficial to you in the long-term if you can decide to stop *NOW*.

Once you have stopped you now need to figure out a way to solve the pain - not by cutting out or neglecting it, but by staring it in the face. Bring your problems out into the light, be honest with yourself. There can be no growth without pain; you are experiencing the emotional pain, now it is time to find the error and therefore your growth.

Begin Your Review

The review process begins in two separate areas: You & Your System. Here are some checklists for you to go through to find out where the problem could lie:

"YOUR SYSTEM" CHECKLIST

Was your system thoroughly tested prior to trading it (or paper traded if you do not have the capacity to program your system into back testing software)?

Did you test with out-of-sample data?

Do you even have a system???? If you do not, how do you even know if the method that you are trading is even profitable??

Is your system's code correct?

Did you over-optimize your system? (What have we discussed about over-indulging?)

Did you paper trade your system prior to placing capital on it?

Did you trade with a small amount of capital prior to placing the rest of your funds on it?

Do you know the system's limitations?

Did you properly drill your system? (See our blog article on why I am the system designer from hell)

"YOU" CHECKLIST

Is the current drawdown you are exhibiting with your system normal?

Are you comfortable with your system's historical drawdown performance?

Are you fully aware of the risks involved with your system and the instrument(s) you are trading?

Are you trading with funds that you are comfortable risking?

Are you relying too heavily on your performance?

Have you set realistic goals?

As you can see there are generally two areas that you need to explore: the mechanical aspect - your system - and the emotional aspect - you. Both can be responsible for making the way you feel the way you do. It will either be an error on the system's side with how the system was tested and/or programmed, or it can be your own psychological profile not being comfortable with the system's performance.

Your Answers = Change = Your Growth

What steps should we now take? Now that we have begun a corrective process where we have stopped the evil nature of our over-indulging ways to take control we should continue our "corrective nature" by invoking our findings and taking ACTION in correcting our errors.

If the problem was mechanical - fix it, if the problem was emotional either go about setting up new thought patterns, or change your current system. The answers lie in whether you need to expand your knowledge in system development, or whether you need to grow emotionally as a person.

Unfortunately there is no easy road, and even if there was everybody would be doing it. Hopefully this article has made you ponder over some of your behaviors during drawdown periods, be sure to keep an eye on yourself and as always take care of your body, because there's no use in making all the money in the world when you don't have the physical capacity to enjoy it

Article Source: kokkada.com

Sunday, August 13, 2006

Don’t Loose Money, Invest In Forex Accounts

Have you lost money because your local currency depreciated against major currencies?I believe you should try investing in forex accounts.

A Forex Trading Managed Account (or, hedging fund account) is the investment vehicle that beats devaluation far more than traditional portfolios. A Forex Managed Account is an investment portfolio, privately owned by an individual or institution, but managed professionally by experienced traders in the global currency market.

Here are a few advantages of a forex managed account:

You also have access to check the activity of your account 24 hours around the clock showing you the net value via internet.

You are not affected by the declining value (prices) of any of the currencies your trader will invest in.

You earn above average returns on your investment.

Your funds are kept in a world-wide accepted convertible currency at a first class bank.

You are the only person having access to your account.

Due to all these reasons, I believe that investment portfolios are an excellent foreign exchange generating opportunity for developing countries.